How to set up Incidite
Updated
In this guide you will learn:
How to set up a secure login.
How to create basic structures such as teams and services.
How to set up the main features (Monitoring, Alerting & Statuspage).
How to connect communication providers and create broadcast channels.
Why the above structures are important for seamless incident management.
Overview
Personal settings and security
Under Settings → Account → General, you can change your name and email address, as well as your preferred language and time zone. In the Security section, you can change your password and set up two-factor authentication (2FA) and WebAuthn.
To set up two-factor authentication, select Start Setup. Next, you'll need an authenticator app on your smartphone that allows you to scan the QR code or, alternatively, enter the authenticator app secret. Enter the verification code from your app into the dedicated field and click on Save. Now follow the instructions on your device to complete the setup.
To set up WebAuthn, first enter a name in the "Security Key Name" field. Then click Add Security Key and follow the instructions on your device.
Creating Teams and Services
Teams allow you to divide the people in your organization who use Incidite into different areas of responsibility — for example IT, customer service, or logistics. Different teams typically have different tasks and responsibilities, which is why separating them is recommended. Otherwise, every team would receive every alert or incident and lose sight of their own responsibilities.
Services represent the (digital) structures of your organization that are required for smooth internal and external operations. Examples include websites, API interfaces, logistics, web applications, and online shops — though this varies from company to company. Different services are managed by different teams and should therefore be clearly separated to ensure the fastest possible resolution of outages.
Creating Teams
A team can be created in under a minute. From your dashboard, go to Teams and click Create Team. You can then name your team and create it right away. People can be added or removed afterwards. You will also get an overview of linked services and on-call schedules. A dedicated guide on on-call schedules can be found here.
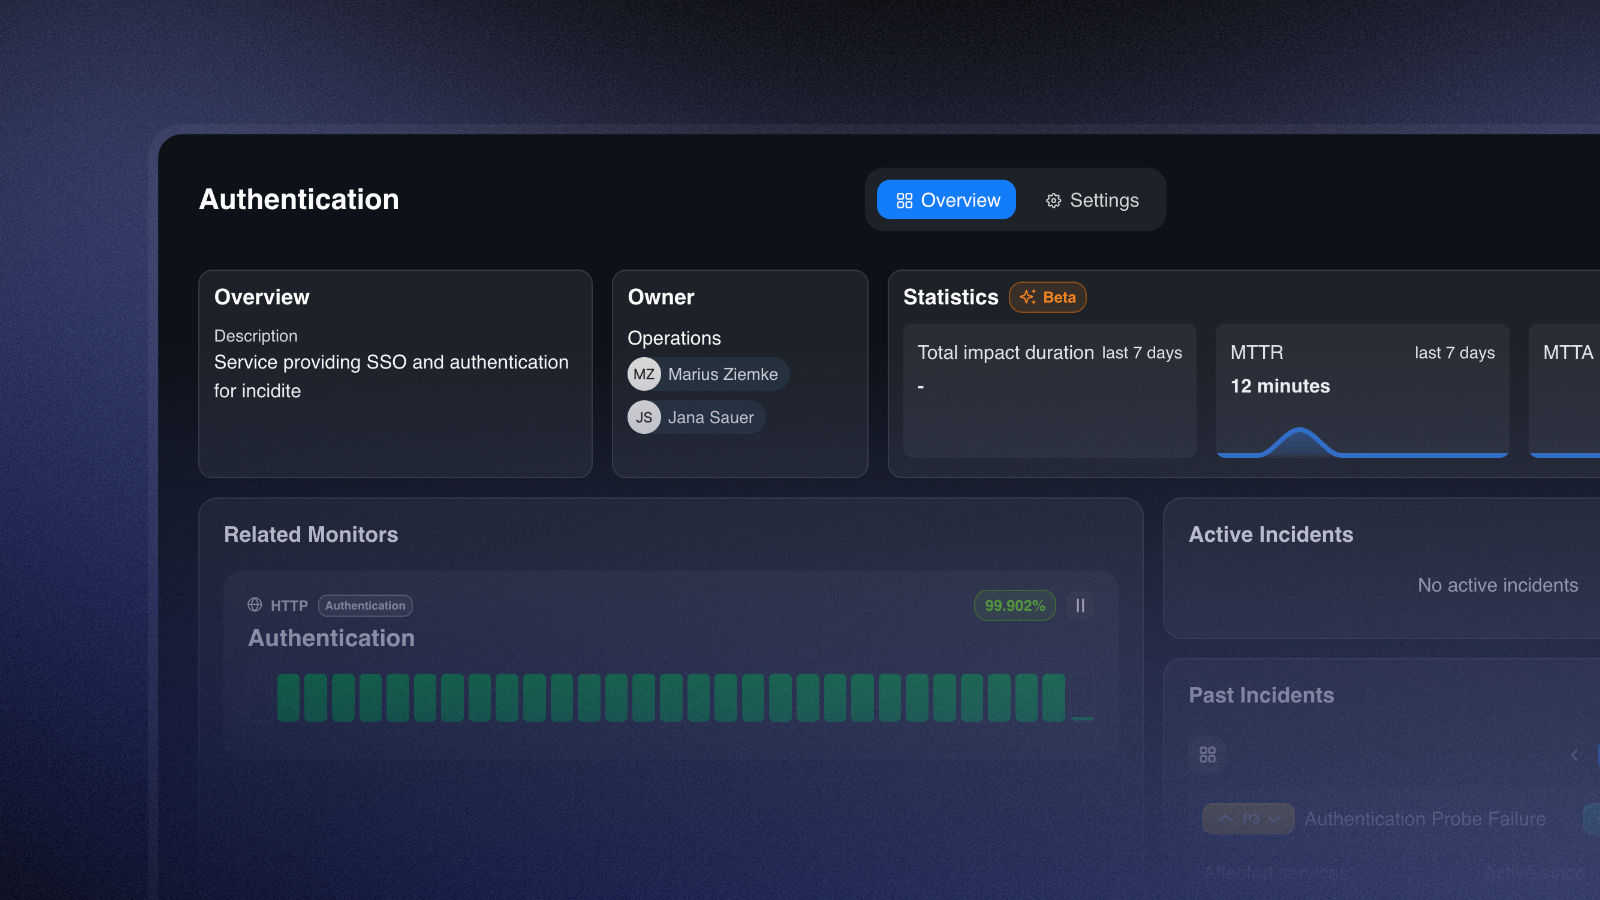
Creating Services
Services can be created just as quickly as a team. Go to Services and select +Create Service, give it a name, an optional description, and link a responsible team. From that point on, the overview will show associated monitors, statistics, ongoing and past incidents, and general information.
Monitors, Alerting, and Statuspage
Monitors track the functionality of digital structures such as websites, servers, databases, and web applications. There are different monitor types with varying areas of responsibility. They help you detect anomalies before they become problems and automatically identify outages. Failed monitoring probes generate alerts, though these do not necessarily have to escalate into an incident.
Alerting refers to notifying responsible individuals about generated alerts — monitoring and alerting therefore go hand in hand. These alerts can escalate into incidents, which typically results in a larger group of people being notified.
A statuspage serves as a central point of reference for users and stakeholders to check the availability of various services offered by a provider. Incidents, maintenance windows, and general announcements can be communicated through it.
Creating Monitors
You can create a monitor under Monitors by clicking Create Monitor. Assign a name and link a service so that it's immediately clear which service is affected when an alert is triggered.
By selecting an interval, you can control how frequently your monitor checks the functionality of a service. You can choose intervals ranging from ten seconds to ten minutes.
Retries specify how many times your monitor will re-check functionality after a failed probe before triggering an alert. For example, with three retries, a monitor probe must fail three times before an alert is triggered and responsible parties are notified.
Under Regions, choose up to three locations from which your target should be monitored and specify, how many of them have to fail to trigger an alert (all regions/a majority of regions/any region).
Multiregion monitoring is only available in the Basic and Pro plan.
Next, you select a monitor type - either ICMP (also known as PING) or HTTP. ICMP only requires a web address or IP address as its target. You also define the timeout (the maximum amount of time allowed for the monitored service to respond to your monitor's request).
An HTTP monitor also requires a web address and a timeout. In addition, you select the method the monitor uses to check your service. The available options are: GET, POST, PUT, DELETE, PATCH, HEAD, and OPTIONS.
You can also specify valid status codes (always 3 digits) and headers (key + value). Status codes determine whether a probe fails by indicating whether the monitor's request was successful. The most well-known status code is probably 404 – Not Found. By specifying headers, a monitor can provide you with specific information beyond the standard request — for example, the keys monitor_id, probe_type, and service_name, which you can find in the metadata of your alert.
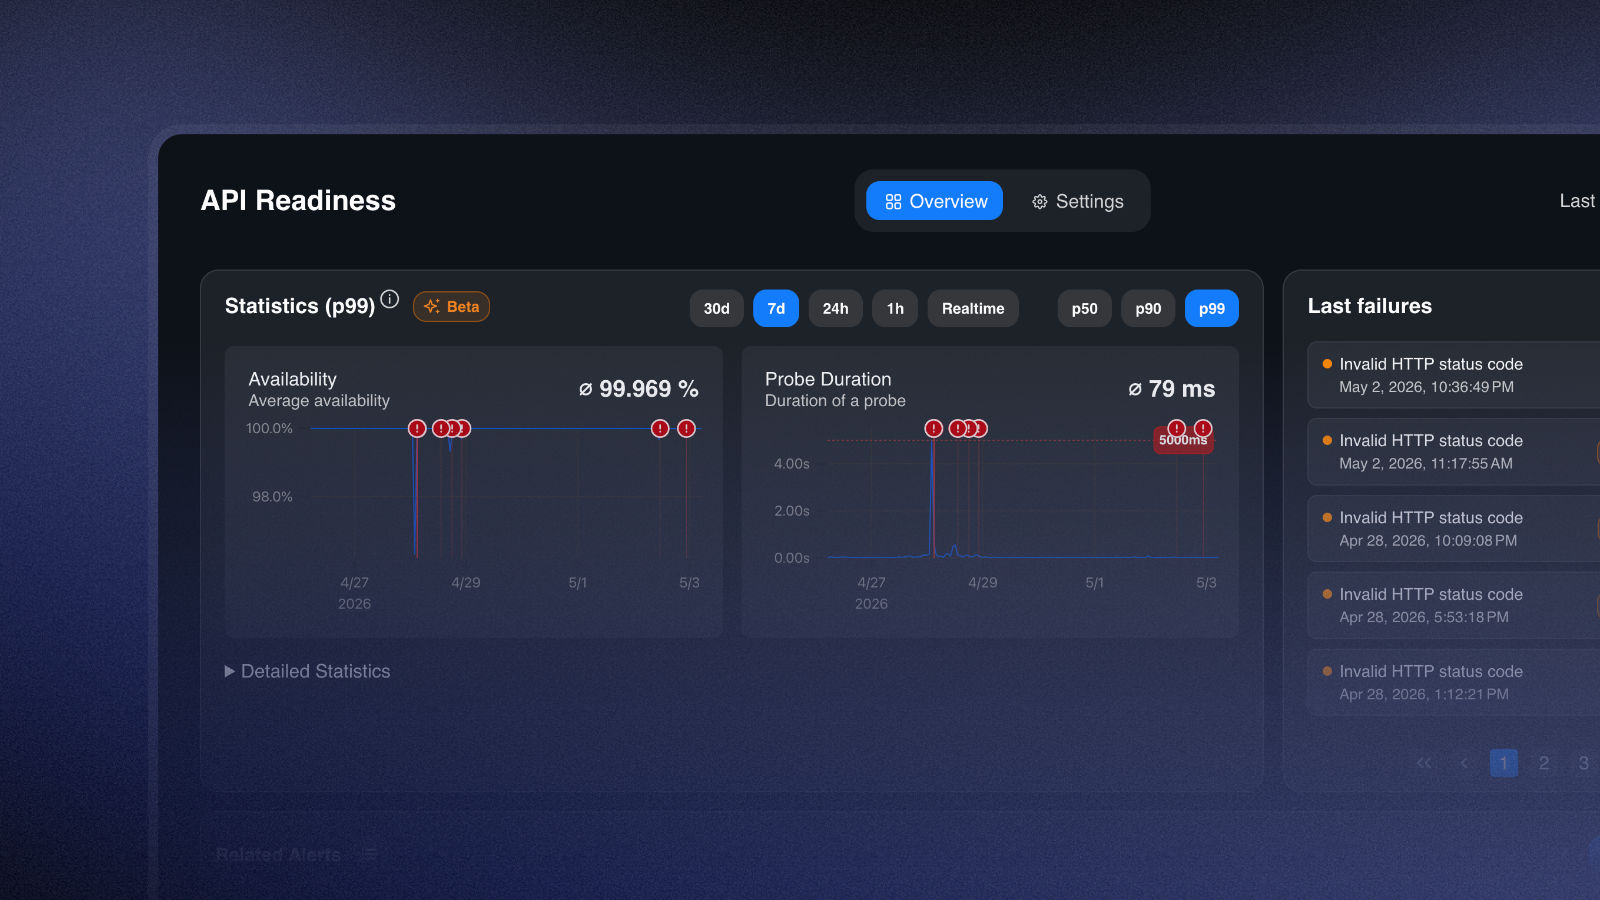
In the monitor overview, you can see the most recent failures, associated alerts, and detailed statistics. Explanations of the statistics can be found here.
Setting Up Alerting
Alert Processor
The alert processor processes and correlates alerts to avoid duplicates.
Go to Settings → Incidents → Alerts to create a data source and a processor. We provide a default processor, which you can customize individually under View Processor.
Alternatively, under Create Alert Processor, you can add your own processor. Choose between statistical and AI-based alert correlation. Statistical correlation is based on a similarity threshold that you can set yourself, with values between 0 and 1. You can assign a weighting to self-selected keys and values on a scale of 0 to 100 — representing percentages. This allows different pieces of alert information to be weighted differently. Otherwise, all alert information is factored equally into the similarity score calculation.
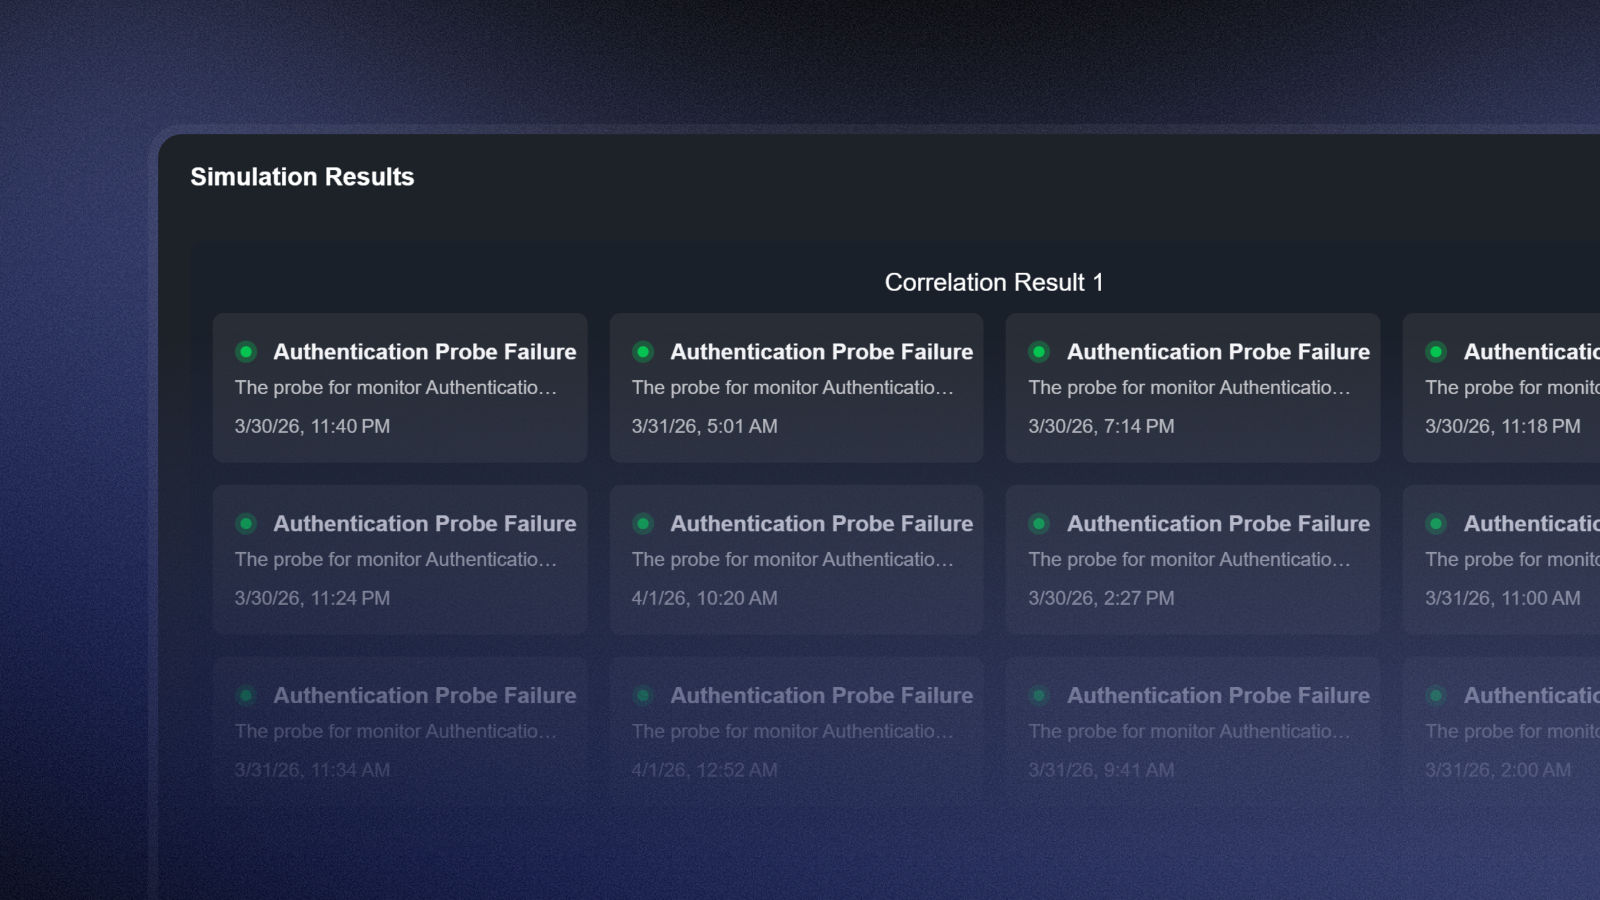
The alert processor simulation lets you verify whether your custom settings reliably correlate alerts that you would also manually identify as duplicates.
If you enable Automated Incident Creation under Configuration, Incidite will automatically create incidents from your alerts.
Alert Sources
Your created monitors are your first data source. You can add additional sources by clicking Create Alert Source, linking a processor, and providing a name.
The "Alertmanager" type is currently fixed and is supported by Prometheus.
You will then be shown a webhook endpoint and a secret. These must be entered in your alerting integration to forward the data to Incidite.
Setting Up a Statuspage
Create your first statuspage under Statuspages → Create Statuspage by giving it a name and setting its visibility.
Private status pages and customizable domains are only available in the Basic and Pro plans. After your trial period ends, you can only create public status pages on the Free plan.
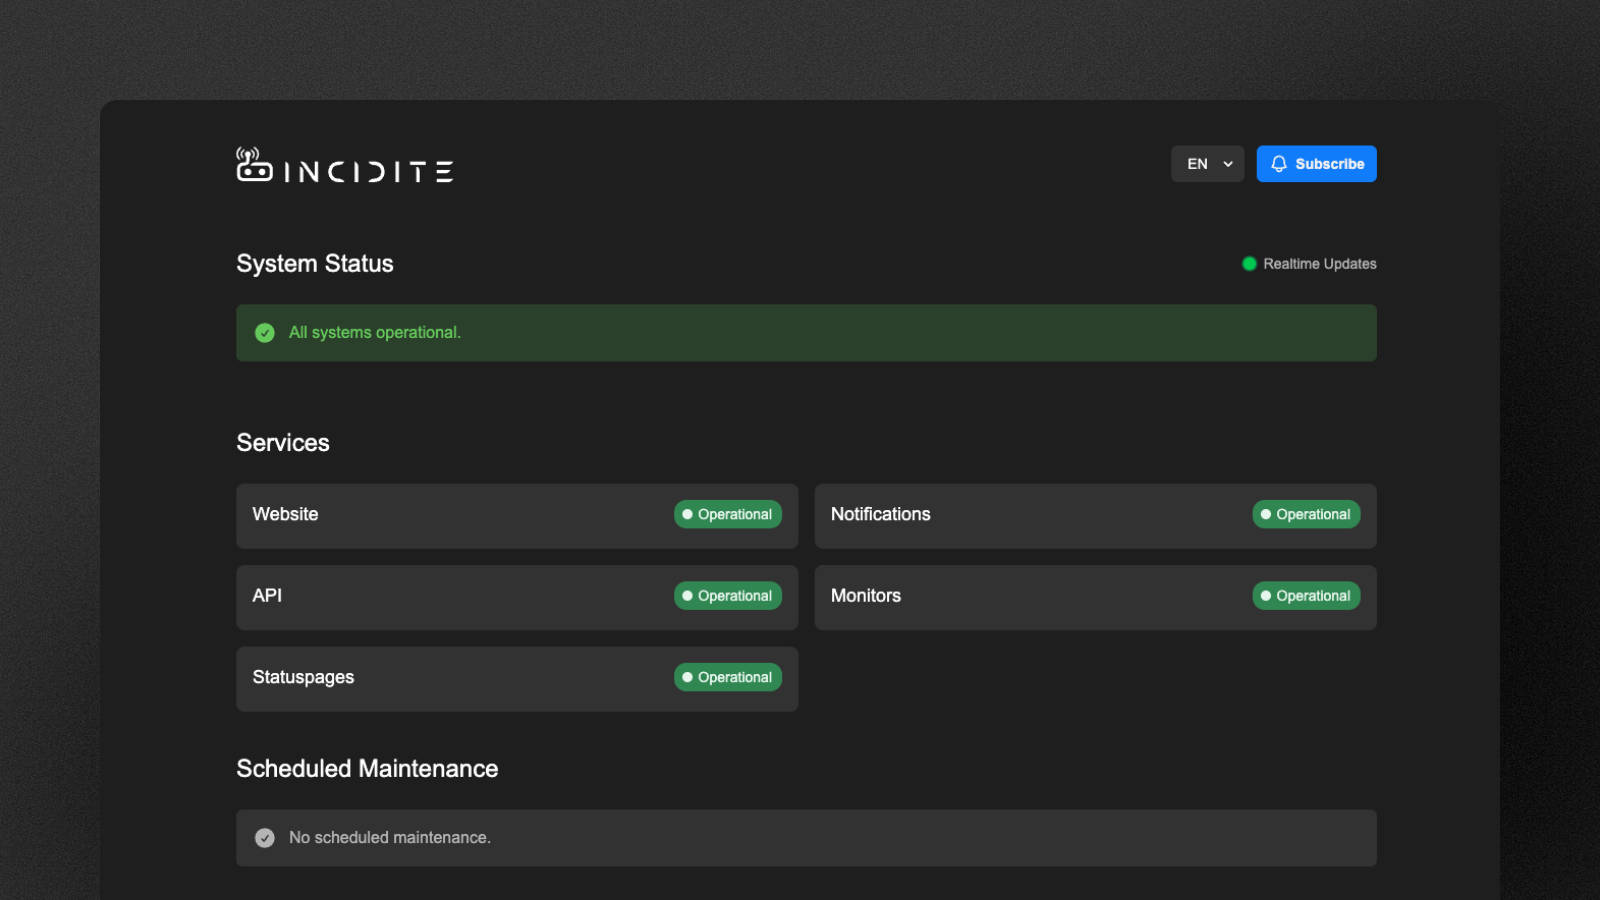
In the next step, add components (services) by clicking Add Component. You can give the selected components descriptions that will be displayed on your statuspage. You can access your statuspage at any time via the View Statuspage button or through its link. Under Settings, you can change the name, visibility, and domain. You can also upload your logo and adjust the colors to align the statuspage with your brand identity.
This is what Incidite’s statuspage looks like:
For more details on customizing your statuspage, see the guide How do I customize a statuspage?
Communication Providers and Broadcast Channels
Connecting Communication Providers
We currently offer Slack and Discord as communication platforms. To connect them, simply go to Settings → Communication → Providers, select Enable Provider, and follow the provider's instructions.
A broadcast channel can only be created for a provider once it has been activated.
Creating Broadcast Channels
Under Settings → Communication → Broadcast Channels, you can create channels through which incident notifications are sent. Click Create Broadcast Channel and use IQL (Incident Query Language) to define which types of incidents should be sent through this endpoint. If you leave this field empty, all incidents will be sent.
A comprehensive list of IQL commands can be found here.
Next, select the provider — either Slack or Discord. When creating your first broadcast channel, keep New Notification Endpoint selected and either choose an existing channel or create a new one so that Incidite can set up a notification endpoint for you there. Later on, you can select previously created endpoints and use them to create new channels.
You have now learned how to set up the core features of Incidite and use them for incident management. Your services are being monitored, and you will be notified via email and through your own broadcast channels whenever something goes wrong. You can also display incidents on your own statuspage.
If you have any questions, you can reach us at any time at support@incidite.com. Enjoy incident management with Incidite!