Creating and updating incidents
Updated
In this guide, you'll learn:
how to create incidents.
what features your incident dashboard offers.
how to keep colleagues, customers, and stakeholders up to date.
Overview
Creating an Incident
You can create incidents in several ways, both manually and automatically.
Creating Incidents manually
On your general dashboard, you'll find the Create Incident button under Active Incidents. It's also located in the Incidents menu. When you click Create Incident, the creation mask appears.
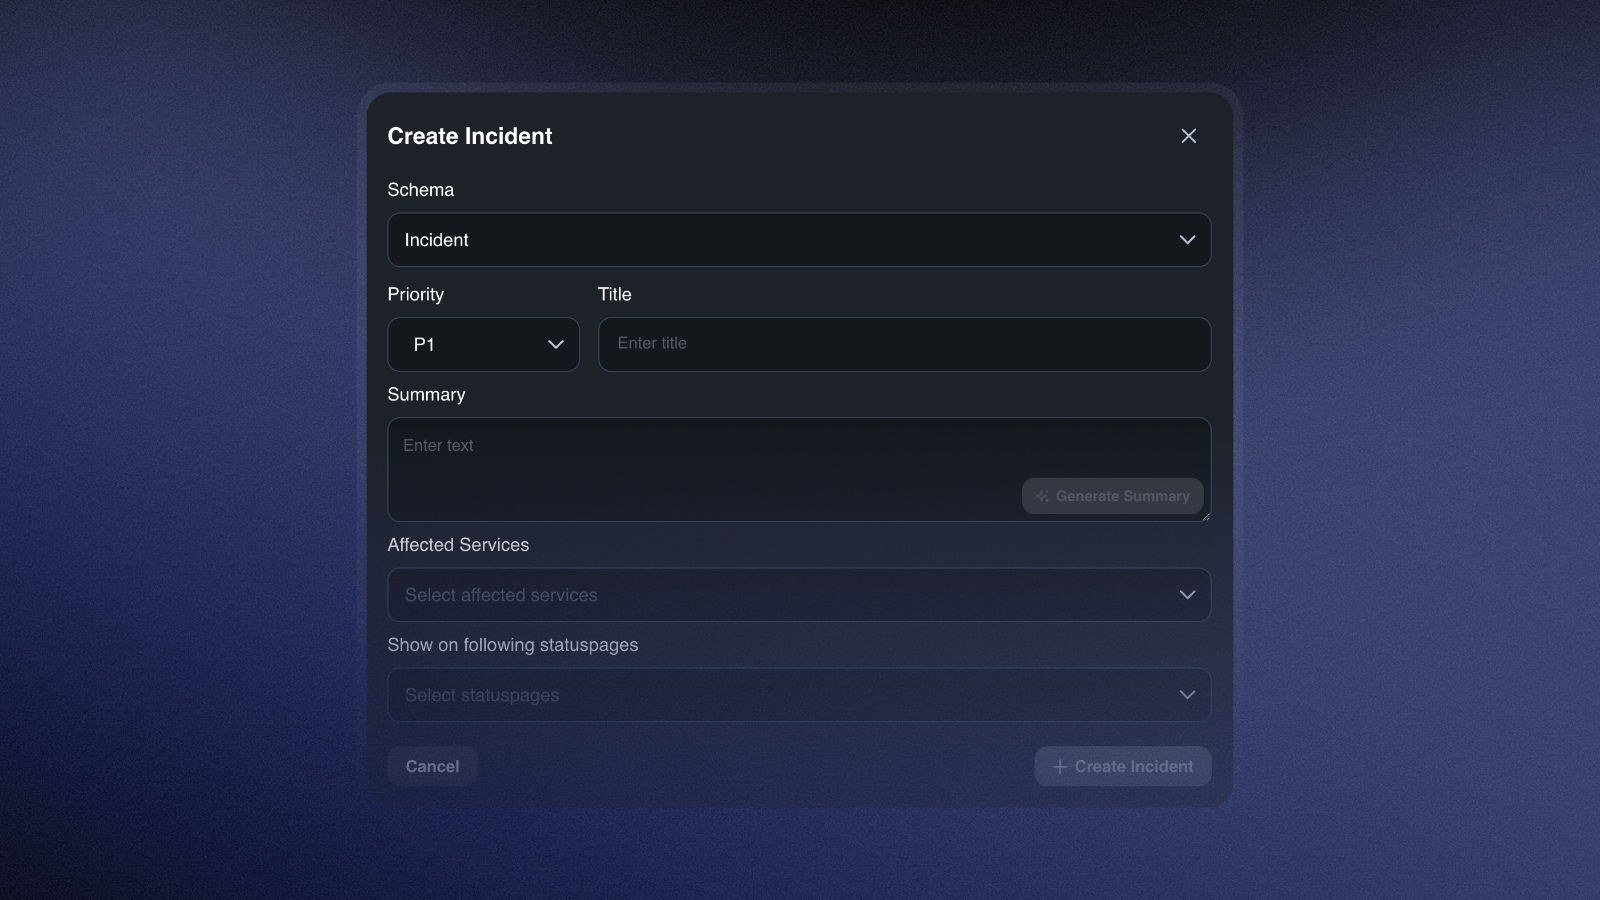
Under Scheme, choose between Incident or Maintenance. You can adjust the urgency level under Priority - where P1 is the highest and P5 is the lowest. You can use AI to polish the Title and Summary of the incident under Generate Summary.
Under Affected Services, select the services that are or could be impacted by the incident. You can remove services or add new ones at any time. Finally, you can select a status page where the incident should be published. You can also remove or add status pages at any time.
Create Incidents Automatically
You can set up the system to automatically create incidents from alerts. To do this, simply go to Settings → Incidents → Alerting, select a processor (→ View Processor), and enable Automated Incident Creation under Configuration.
When an alert is resolved, the incident created from it is not automatically resolved.
Features of the Incident Dashboard
You can view and edit all key details of your incident in a clear, easy-to-navigate dashboard. Below, we'll explain how to navigate the dashboard.
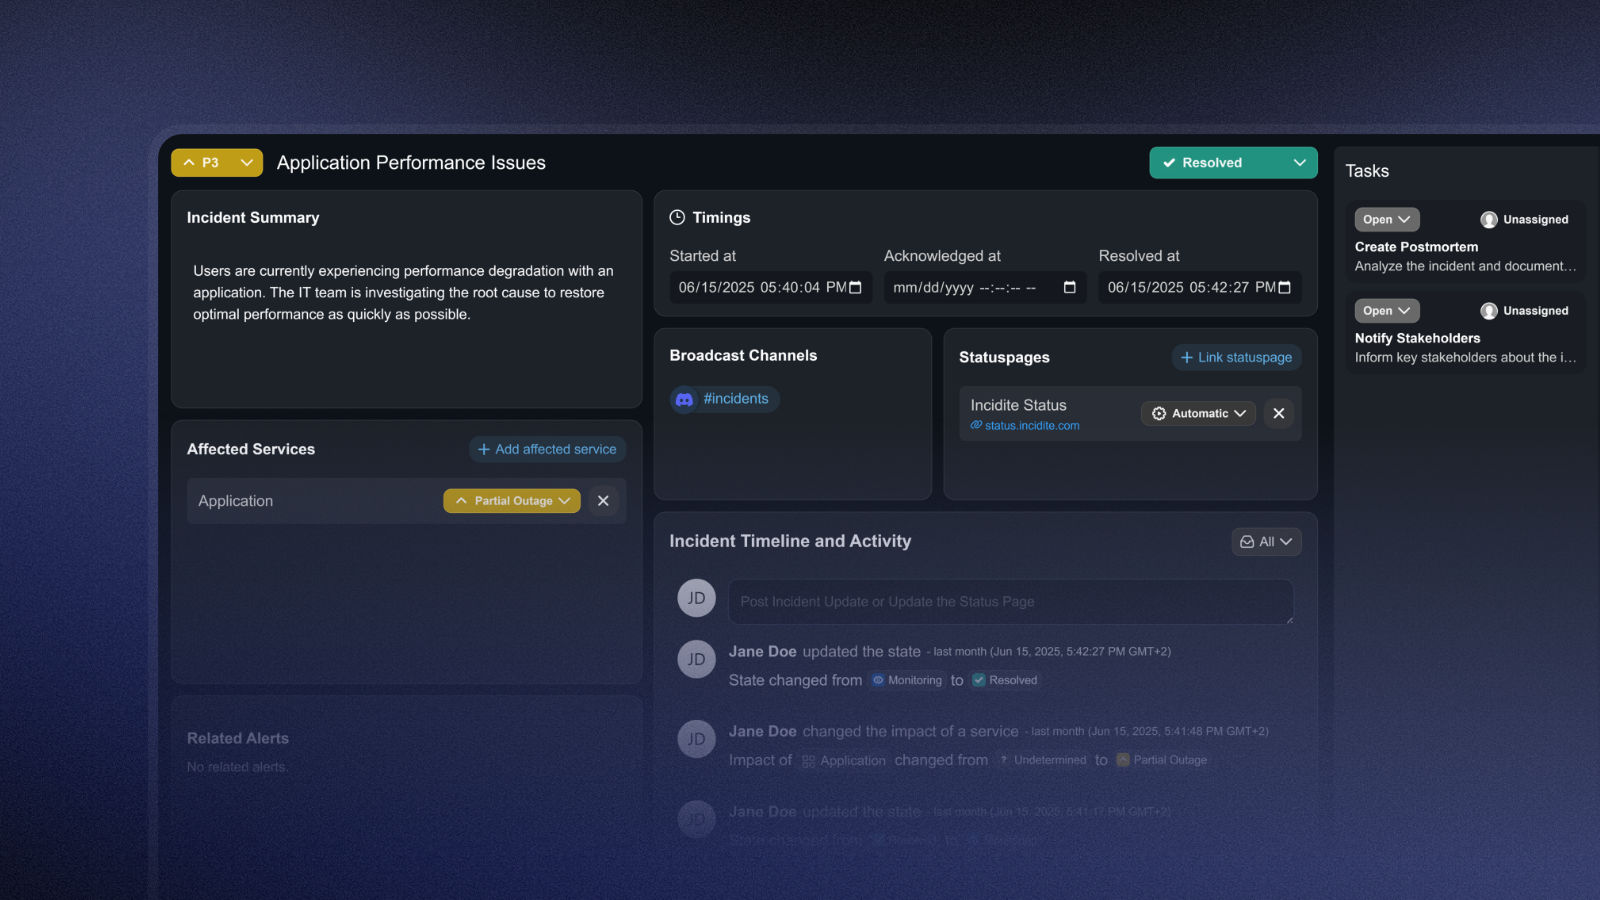
The left side: Details of your incident
On the left side of your dashboard, you can view and edit all the important information about your incident.
Change the priority, title and summary
The priority indicates how critical the incident is. For incidents, P1 represents the highest priority and P5 the lowest. For Maintenance, you can choose between Routine, Security, and Emergency.
The title should briefly describe the issue.
The summary describes the problem in more detail and, if necessary, outlines initial steps to address it.
You can change these three fields at any time.
Edit affected services and view alerts
You can add or remove affected services at any time. You can also specify the severity of the service disruption:
Undetermined: The nature of the disruption is not (yet) clear.
Partial Outage: The service is partially restricted.
Major Outage: The service is unavailable.
If the incident originated from an alert, you'll find it under Related Alerts, and the affected service will be added automatically.
In the middle: Internal and external incident communication
The middle section of your incident dashboard is dedicated to communication.
Adjust incident status
Initially, every incident is set to New. The following statuses are also available:
Acknowledged: The incident has been acknowledged.
Investigating: The issue is currently being resolved.
Resolved: The incident has been resolved and functionality has been restored.
By default, Maintenance has the status Planned. In Progress means that the maintenance work is currently underway, and Completed indicates that it has been finished.
View critical dates
Under Timeline, you can find the start time of the incident, as well as the times it was detected and resolved.
Communicating via broadcast channels and status pages
Under Broadcast Channels, you can see which channels the incident is displayed in. This depends on whether you:
have created broadcast channels and
which filter (IQL) you have applied to each channel.
You cannot retroactively push an incident or maintenance task to broadcast channels or add a channel to your incident. This is only possible for the following incidents in the settings (Settings → Communication → Broadcast Channels). Read here to learn how to use IQL (Incident Query Language) as a filter.
You can also find a guide on how to create a broadcast channel here.
On the Statuspage card, you can link to status pages where the incident or maintenance work should be visible. Here, you can specify the Global Impact, which is independent of the status of your affected services. It works as follows:
Automatic: The global impact is determined by the highest impact on your affected services.
Undetermined: The impact on your product is not (yet) known.
Partial Outage: Your product is partially unavailable.
Major Outage: Your product is unavailable.
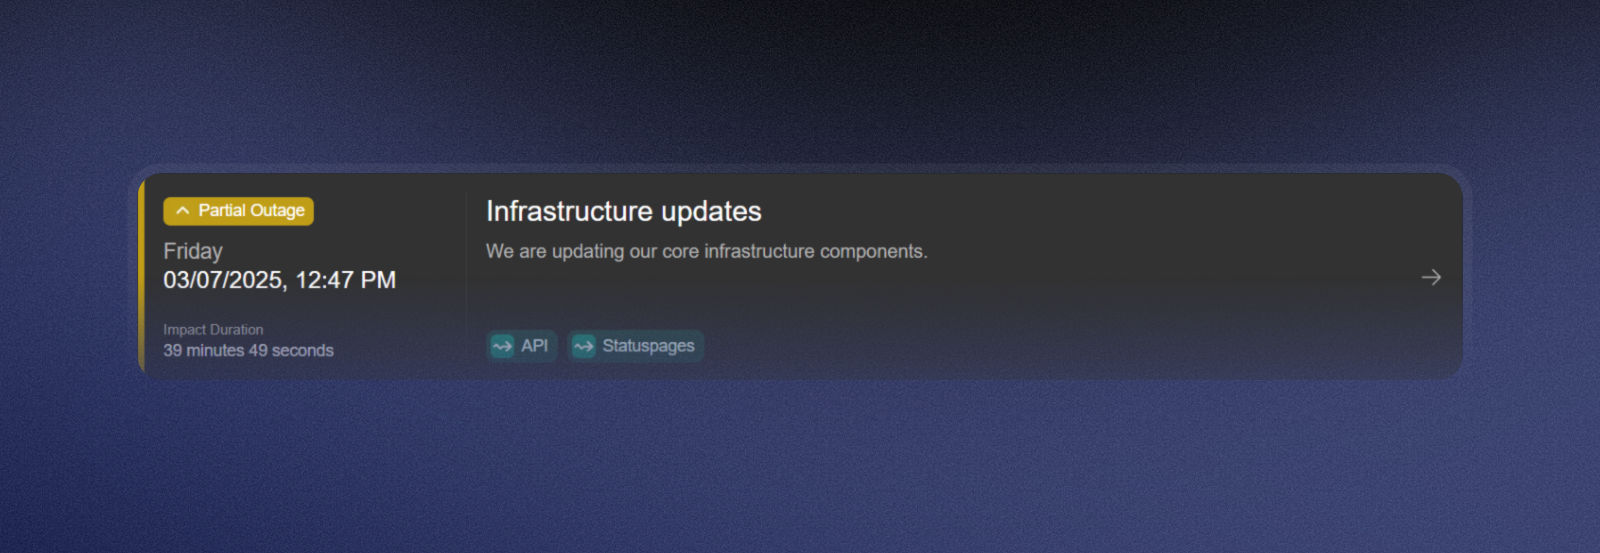
Why do we even distinguish between the impact on services and the impact on the product as a whole? An outage affecting a single service does not necessarily translate into an outage affecting the product as a whole. In other words, a service could go down completely without significantly disrupting the product or critical operations. Conversely, even a minor outage can disrupt operations and prevent access to a product.
Here is an example of maintenance work during which the services functioned without interruption, but the product was temporarily available only on a limited basis:
Track the timeline and comment on events
Under Timeline and Activities, you'll find all updates related to the incident, as well as a comments section. Both the updates and manual comments are published on the status page so that customers and stakeholders can follow the current status in real time. When posting a comment, you can also choose whether or not it appears on the status page.
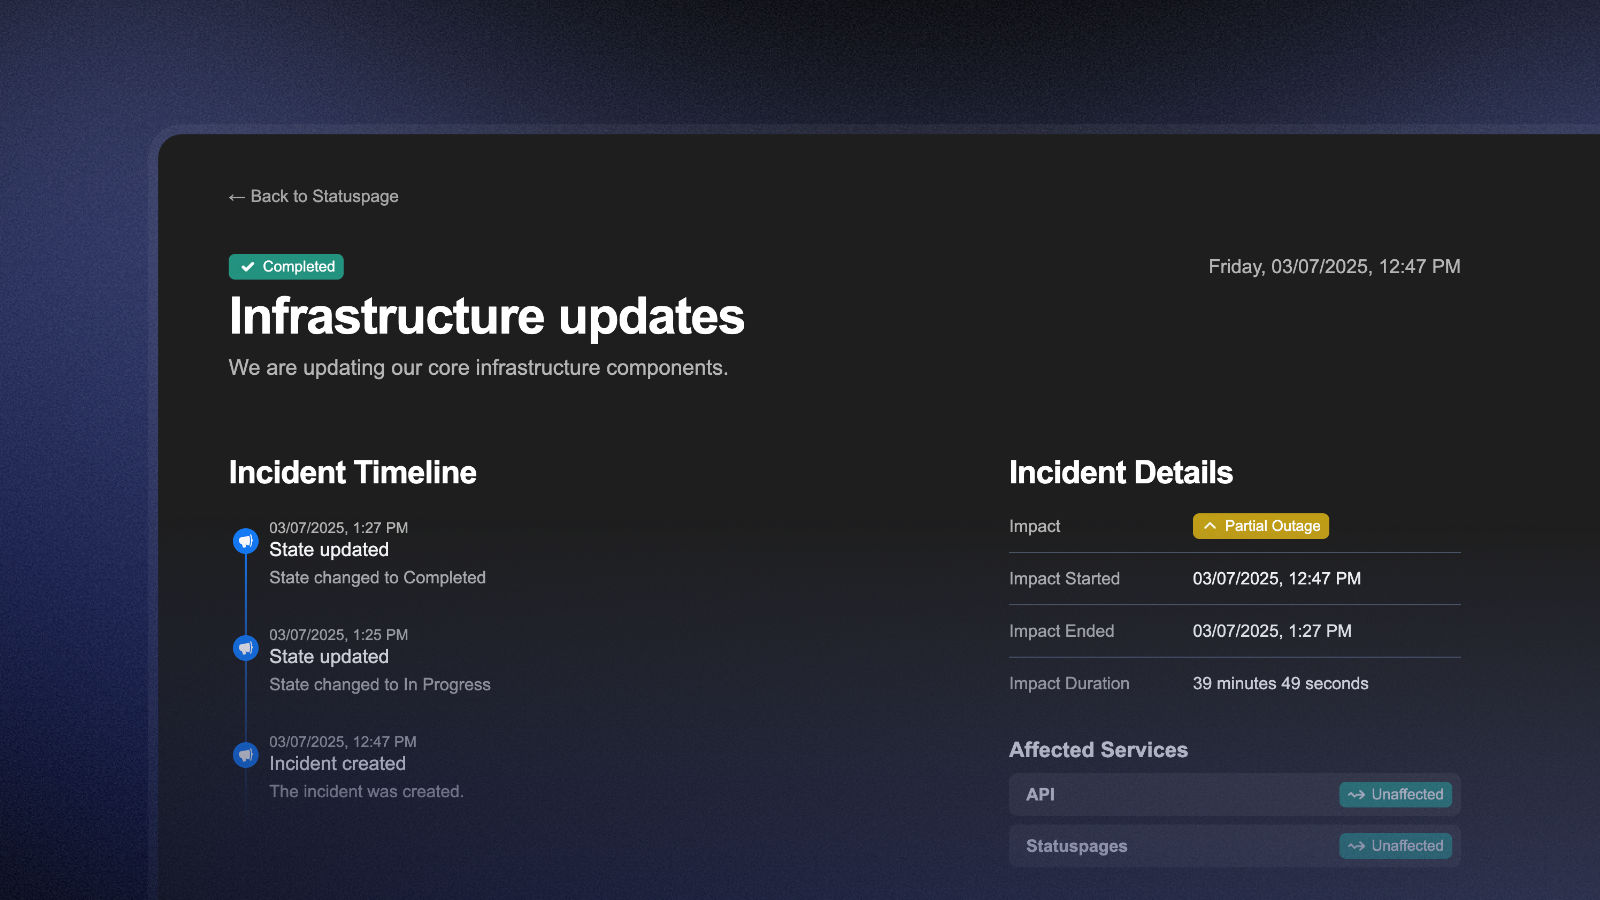
This is what a timeline looks like on the status page:
On the right: Organization and Settings
In the right-hand column of your incident dashboard, you can organize your incident.
Create and assign roles and tasks
To establish clear responsibilities and keep track of all important tasks, Incidite lets you predefine and assign roles and tasks.
Roles and tasks must be created before an incident is created; otherwise, they will not appear on your dashboard.
Here's how to create roles and tasks in advance:
Roles: Go to Settings → Incidents → Incident Roles and create a title and description for the role under +Create Role.
Tasks: Under Settings → Incidents → Incident Schemas, you can create new task templates under Incident or Maintenance by clicking +Create Task Template and entering a name and description.
You can view Roles under the person icon on the far right of your dashboard and assign them to yourself or another member via Assign Role.
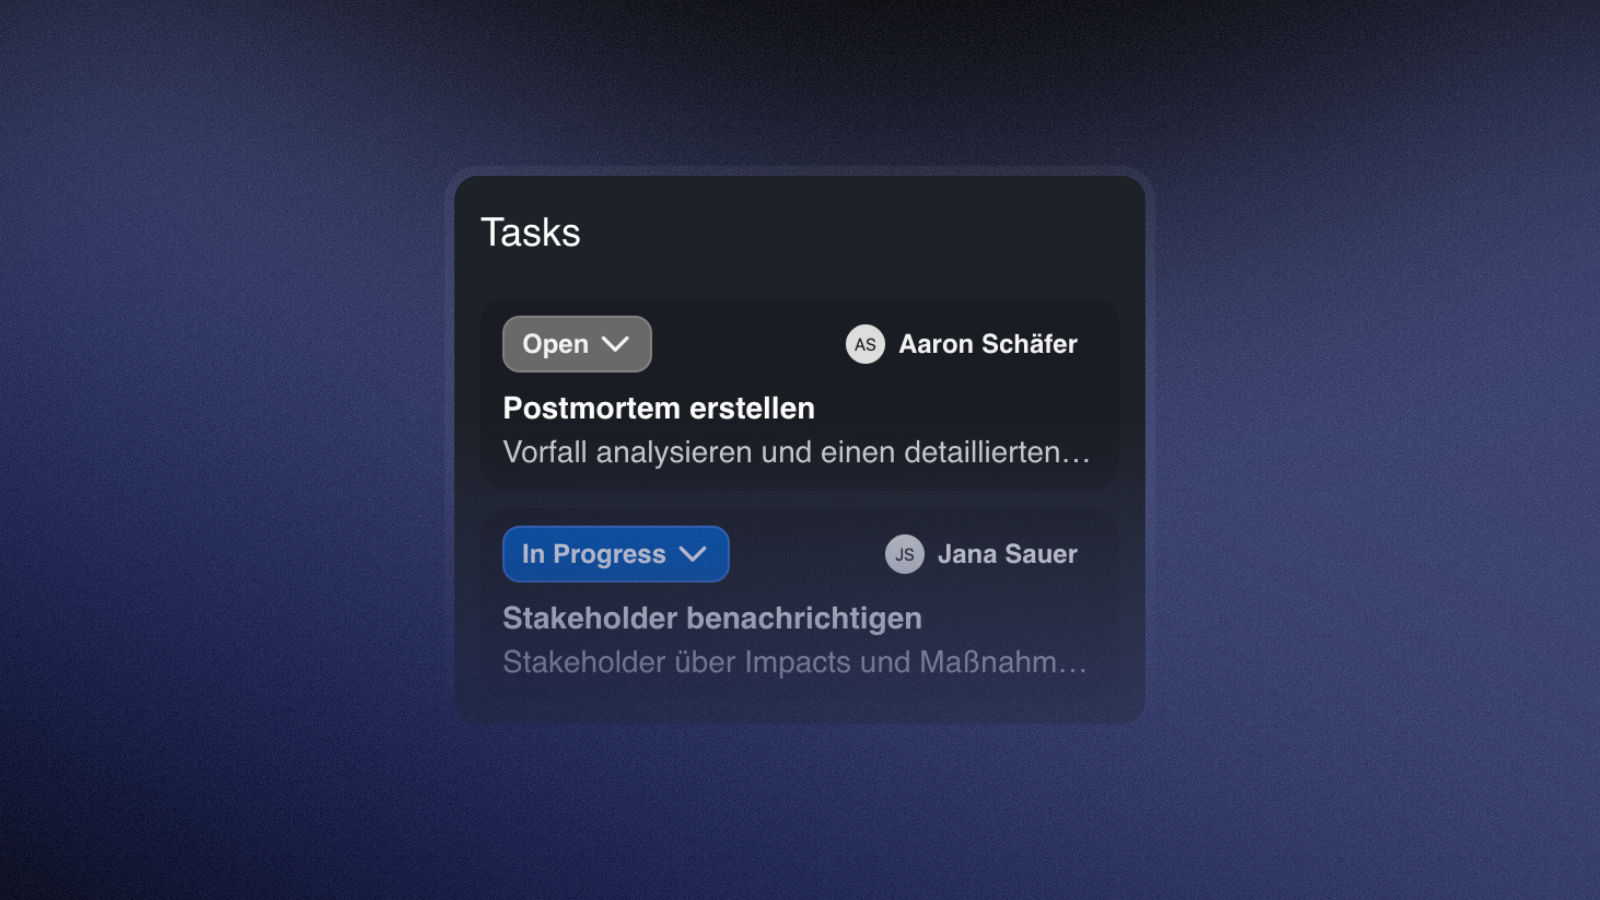
You can also find Tasks in the right-hand sidebar under the checkmark icon. You can change the assignment by clicking Unassigned in the top-right corner or the name of the team member who currently holds the role. In the top-left corner of each task, you'll find a dropdown menu that lets you change the task's status to Open, In Progress, or Completed.
Incident Settings
You can find the settings under the gear icon in the right-hand sidebar. Here, you can configure the following:
Card styles: You can customize the appearance of the dashboard's various cards (Summary, Timeline, Alerts, etc.) by selecting Glass, Neutral, or Transparent from the dropdown menu.
Editable Incident Dashboard: If you enable Editable, you can rearrange the cards on your dashboard as you like and resize them to customize your dashboard to your preferences. For example, you can move less important cards to the bottom or make them smaller.
Delete Incident: Here you can delete your incident. Warning: All incident data will be deleted and cannot be recovered!