Incident Metrics That Actually Matter and How to Improve Them
Updated on
Jana Sauer
An alert fires in the middle of the night. The on-call engineer wakes up, acknowledges the page, and starts digging through logs. The service is back up, but three teams had to be pulled in.
The question "How did we do?" arises the next morning. Without incident metrics, the honest answer is: "Not great, but we're not sure exactly where the problem was."
Incident metrics answer that question precisely. They tell you whether your team is slow to detect problems, slow to acknowledge them, or slow to resolve them. Those are three very different bottlenecks requiring three very different fixes.
This guide covers the metrics that matter, what they reveal, and how to actually move the needle on each one.
TL;DR:
The most important incident metrics are
MTTD (detection speed),
MTTA (acknowledgment speed), and
MTTR (resolution speed).
Together they map every phase of an incident lifecycle and pinpoint where your response breaks down. Track all three, not just MTTR. Don't compare your numbers to industry averages but to your own last quarter.
What are incident metrics?
Incident metrics are measurable data points that describe how your team detects, responds to and recovers from incidents. They visualize patterns, trends and bottlenecks. However, a metric on its own is just a number. What makes it useful is tracking it over time. An MTTR of 45 minutes means nothing without context, while an MTTR that improved from 90 minutes to 45 minutes over two quarters tells a story about what's working.
The incident timeline: where each metric lives
Every incident follows the same basic sequence of events, even if the details are different:
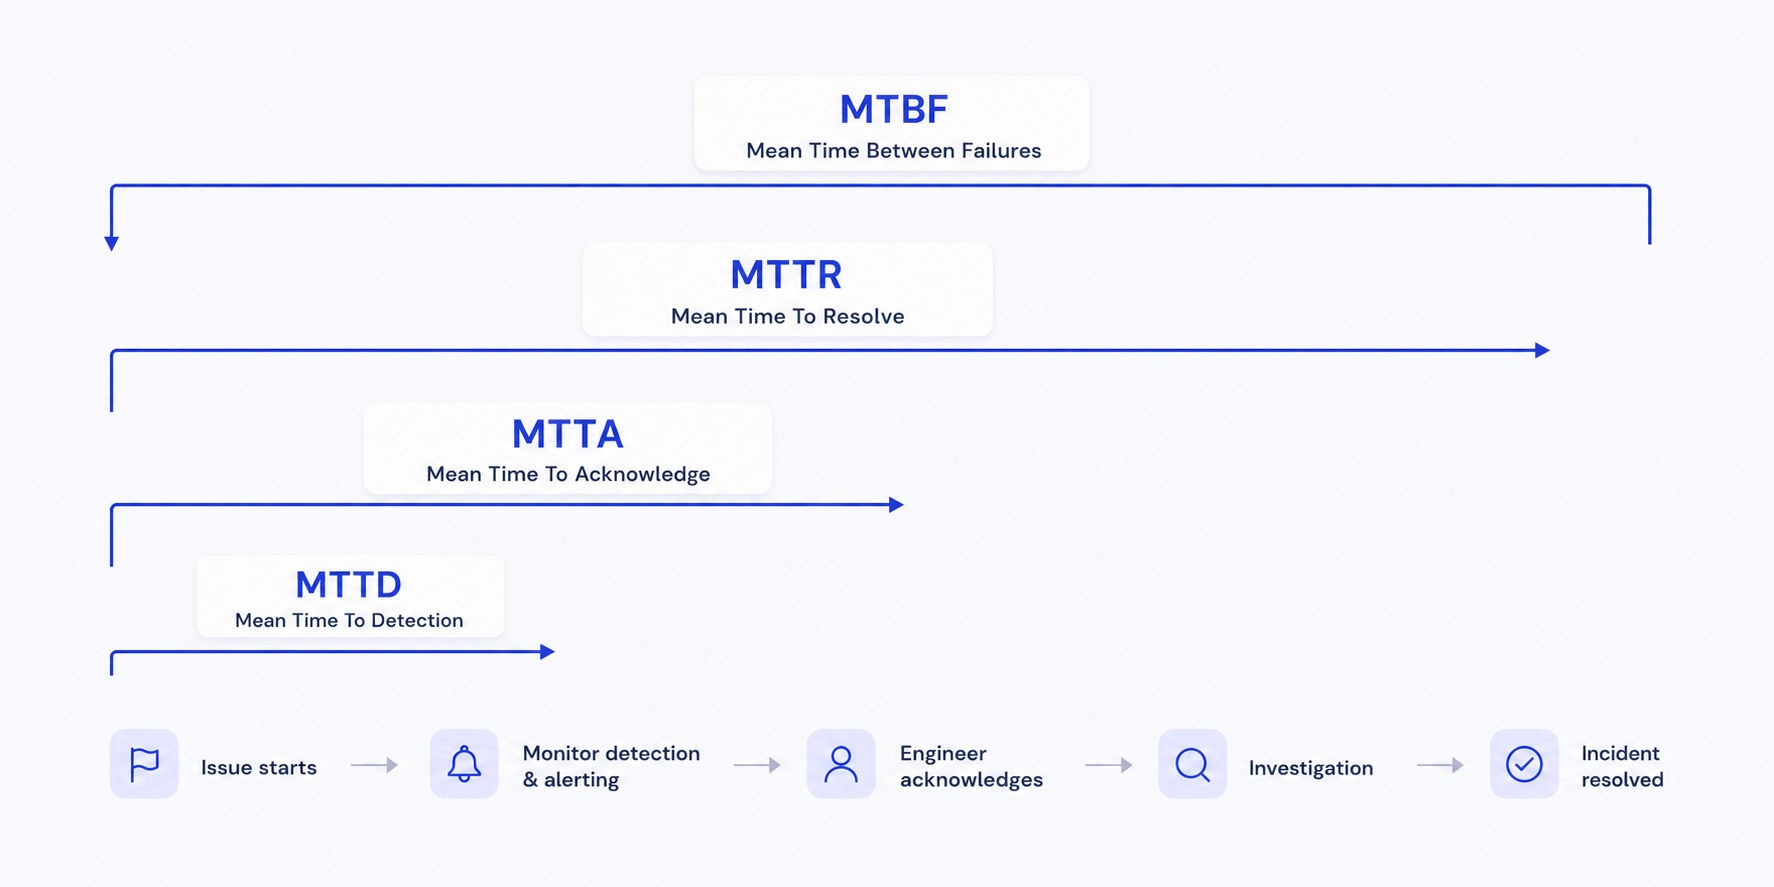
Visualization of most common Incident Metrics
Understanding which phase of the timeline is longest is the first step toward improving your numbers. A team that fires off acknowledgments in 30 seconds but takes four hours to actually fix things has a fundamentally different problem than one that misses alerts for an hour but resolves quickly once it's moving.
Mean Time to Detect (MTTD)
MTTD = Sum of all detection times ÷ Number of incidents
MTTD measures the average gap between when an issue actually starts and when your monitoring system identifies it. If your database starts throwing errors at 2:00 AM and your alert fires at 2:08 AM, your detection time for that incident is 8 minutes.
A high MTTD usually points to one of two things: insufficient monitoring coverage or alert thresholds set too conservatively. Some teams also see MTTD rise when they're managing systems with high complexity, because microservices and multi-cloud setups create more places where problems can hide.
For production service incidents, the goal is typically sub-5-minute detection for critical paths. The Equifax breach in 2017 went undetected for 76 days. That's an extreme example of what high MTTD costs in practice.
Audit your monitoring coverage against your actual system topology to improve your MTTD. If a service has no dedicated health check, a problem there only surfaces when customers notice, which is the worst possible way to detect an issue.
Mean Time to Acknowledge (MTTA)
MTTA = Sum of time from alert to acknowledgment ÷ Number of incidents
MTTA measures how long it takes your team to acknowledge an alert after it fires. This is distinct from detection, since MTTA captures how quickly a human picks it up instead of your monitoring.
A high MTTA often signals alert fatigue. When engineers receive dozens of low-quality alerts daily, they train themselves to ignore the noise. That habit becomes dangerous when a real critical alert arrives. If your MTTA is creeping up, it's worth asking how many of your alerts actually require immediate action.
Another reason can be on-call scheduling gaps. If nobody is actually responsible for an alert, it won't get acknowledged quickly. A well-structured on-call rotation with clear escalation paths is the fix here, not faster engineers.
Mean Time to Resolve (MTTR)
MTTR = Total downtime ÷ Number of incidents
MTTR is the most widely tracked incident metric and also the most misunderstood, largely because "MTTR" can mean four different things:
Mean Time to Recover: from incident start to full service restoration
Mean Time to Respond: from first alert to resolution (without the detection gap)
Mean Time to Repair: from when engineers start working to when the fix is deployed
Mean Time to Resolve: from incident start to root cause eliminated (often longer than recovery)
This distinction matters. A team might restore service in 20 minutes but the underlying bug doesn't get fixed for two weeks. Both are worth tracking even though they measure different things.
MTTR is genuinely useful as a north-star metric, but it doesn't tell you where your time is actually going. A team with an MTTR of 90 minutes might be spending 60 of those minutes just figuring out what broke and only 30 minutes on the actual fix. MTTR often improves automatically when MTTD and MTTA are reduced.
Mean Time to Contain (MTTC)
MTTC is less commonly tracked but might be worth monitoring, because it measures how long it takes to stop an incident from spreading after it's been detected. For a database overload scenario, containment might mean rate-limiting or creating additional capacity. For a security breach, it means isolating affected systems.
It's especially important if your incidents tend to have a "blast radius", where a small issue escalates into a larger one because containment was slow. Tracking MTTC separately from MTTR helps you catch patterns early.
Mean Time Between Failures (MTBF)
MTBF = Total time of operation ÷ Number of failures
MTBF measures the average time between incidents. This metric focuses on incident frequency rather than resolution. A team with a great MTTR but a low MTBF is fast at fighting fires it's constantly starting.
Improving MTBF requires a different set of interventions than improving MTTR: better post-incident reviews, systematic elimination of recurring failure patterns, and investment in system reliability. When MTBF goes up, it's a sign that your prevention work is paying off.
Incident volume and severity distribution
Raw incident count is a simple but revealing metric. If your incident volume is increasing month by month, something structural is wrong regardless of how good your MTTR looks. Tracking by severity level adds more nuance: a spike in SEV-3 incidents is manageable while a spike in SEV-1 is a serious problem.
Severity distribution also exposes whether your severity levels are being applied consistently. If 80% of your incidents are SEV-2, your team is probably under-using both ends of the scale.
SLA compliance rate
If your service has defined SLAs or SLOs, tracking what percentage of incidents are resolved within those timeframes closes the loop between internal metrics and external commitments. A good MTTR doesn't mean much when you're missing SLAs. In this case, either the SLA targets are too tight, or the MTTR numbers are being measured from a different starting point than the SLA clock.
The one thing most teams get wrong with incident metrics
Tracking MTTR alone and treating it as the single source of truth can lead to premature closing of incidents, even when the underlying problem isn't fixed. Engineers learn to resolve tickets to hit the metric, then watch the same incident reopen two hours later.
The fix is tracking a well-balanced portfolio of metrics. High MTTR with low MTTA points to a resolution problem. High MTTR with high MTTA suggests an on-call or alerting problem. Low MTTR but low MTBF means you're resolving incidents quickly but not preventing them. Each combination tells a different story and needs a different intervention.
How to set meaningful benchmarks
Don't compare your MTTR against industry averages from vendor reports. Those numbers aggregate wildly different team sizes, system complexities, and incident definitions into a single figure that's essentially meaningless. Incident metrics aren't a one-size-fits-all.
Instead, benchmark against yourself. Establish a baseline in month one, target a specific improvement by month three, and an even higher one by month six. High-performing teams handling critical incidents typically aim for:
Severity 1: resolution in under 1 hour
Severity 2: resolution in under 4 hours
Severity 3: resolution in under 24 hours
These are targets, not standards. What matters is directional improvement from your own baseline.
Tracking incident metrics in practice
Calculating metrics manually from spreadsheets is possible, but it's tiring and prone to inconsistency when teams measure timestamps differently. Most incident management platforms track them automatically from the timestamps recorded during an incident's lifecycle: when the alert fired, when the first responder acknowledged, when the incident was marked resolved.
Incidite captures the full incident timeline automatically, so MTTA and MTTR are calculated from the source data rather than reconstructed from memory. That consistency matters when you're trying to identify genuine trends rather than statistical noise from inconsistent measurement.
Incident metrics won't fix your incidents. Instead, they'll show you exactly where your response process needs work. Track the full set, compare against your own baseline, and treat a rising MTBF as the metric that shows your reliability culture is actually working.
If you're looking for a starting point on the process side, our guide to incident management walks through how to structure your response workflow end to end.
FAQ Incident Metrics
What's the difference between MTTR and MTTD?
What's a good MTTR?
Why does MTTR have so many definitions?
How often should I review incident metrics?
Can tracking metrics lead to gaming?
Thanks for reading!
Got a suggestion or need help? Let us know