5 Best IT Monitoring Tools in 2026
Updated on
Aaron Schäfer
Outages and performance issues hit hard - both in money and in customer trust. Monitoring is the layer that catches them early, often before users notice anything. Plenty of companies still don't have a proper setup in place, even though the case for one keeps getting stronger.
Below, we'll walk through the basics: why monitoring matters and which types exist - and then compare five tools built for IT teams in small to mid-sized companies. No oversized enterprise suites, no obscure niche products.
Why monitoring is important
Avoiding outages
By continuously checking key components (e.g. server load, temperature, network connection), problems are detected early – before they cause a full outage. This allows team members to intervene in time, before users or customers even notice anything.
Optimised performance
Monitoring gives you insight into performance data such as CPU, memory and bandwidth usage. This makes it easier to identify bottlenecks early and provision additional resources ahead of time. As a result, you avoid outages and keep system performance stable.
Longer hardware lifespan
If you continuously monitor your hardware and react immediately when warnings appear, you protect your components. Proactive maintenance (e.g. replacing failing parts in time) can significantly increase the lifespan of servers and devices.
Faster troubleshooting
Good monitoring tools alert you in real time when thresholds are exceeded or services go down. The IT team can react straight away. Some solutions also offer advanced features like remediation suggestions or automated workflows that significantly reduce Mean Time to Repair (MTTR).
Effective monitoring also improves transparency for customers and employees. With integrated status pages, you can communicate incidents early, which helps to build trust.
What exactly is monitoring?
In an IT context, monitoring means the automated observation of systems, applications and infrastructures.
Specialised monitoring software checks the state of hardware and software at defined intervals – for example servers, network devices, databases or web services. Typical metrics include CPU and memory usage, web API response times, network latency or available disk capacity.
The goal of monitoring is to detect deviations from the normal state immediately. That covers simple outages (a server is unreachable) as well as slow‑burn performance issues (e.g. a website’s response time getting worse over time).
💡 In short: monitoring gives you transparency over the health of your infrastructure and is the foundation for high availability and reliability of IT systems.
What types of monitoring are there?
Depending on your needs, different types of monitoring come into play. Often they complement each other to give a complete picture. The most important categories are:
Infrastructure and network monitoring
Focus: hardware, operating systems and network. Here you monitor servers (CPU, RAM, disks, temperature), network devices (routers, switches) and services such as ping/port reachability. Bandwidth usage and overall network traffic are part of this as well. Infrastructure monitoring helps you detect hardware faults, overloaded systems or network bottlenecks early.
Application monitoring (APM)
This is about monitoring applications and services from the software’s point of view. Metrics like database response times, application error rates or business-specific KPIs are key. Application Performance Monitoring helps you identify performance issues in code or dependencies (like slow queries). APM often includes Real User Monitoring (RUM) – measuring real user activity in production to understand user experience.
Synthetic monitoring
Here, synthetic tests are run that simulate user actions. For example, a tool regularly calls a website or API, performs a login or tests a checkout flow. These simulations run from various locations and check not just whether a service is up, but also how fast and how functional it is.
Synthetic monitoring is ideal for ensuring the availability of web services or cloud apps and testing multi-step transactions (user journeys) for errors – before real users are affected.
💡 There are also specialised forms like log monitoring (continuous analysis of log files for errors or security events) or event log/trap monitoring (evaluating system messages in real time). In practice, the lines between categories blur: many full‑stack monitoring tools include features from several of these areas.
💡 On‑premises vs. cloud: Traditionally, monitoring solutions were installed in your own network (on‑premises). Today, cloud‑based monitoring services are very popular. They don’t require your own server infrastructure – you simply sign up with the provider and can start monitoring right away.
Five monitoring tools compared
1. Incidite
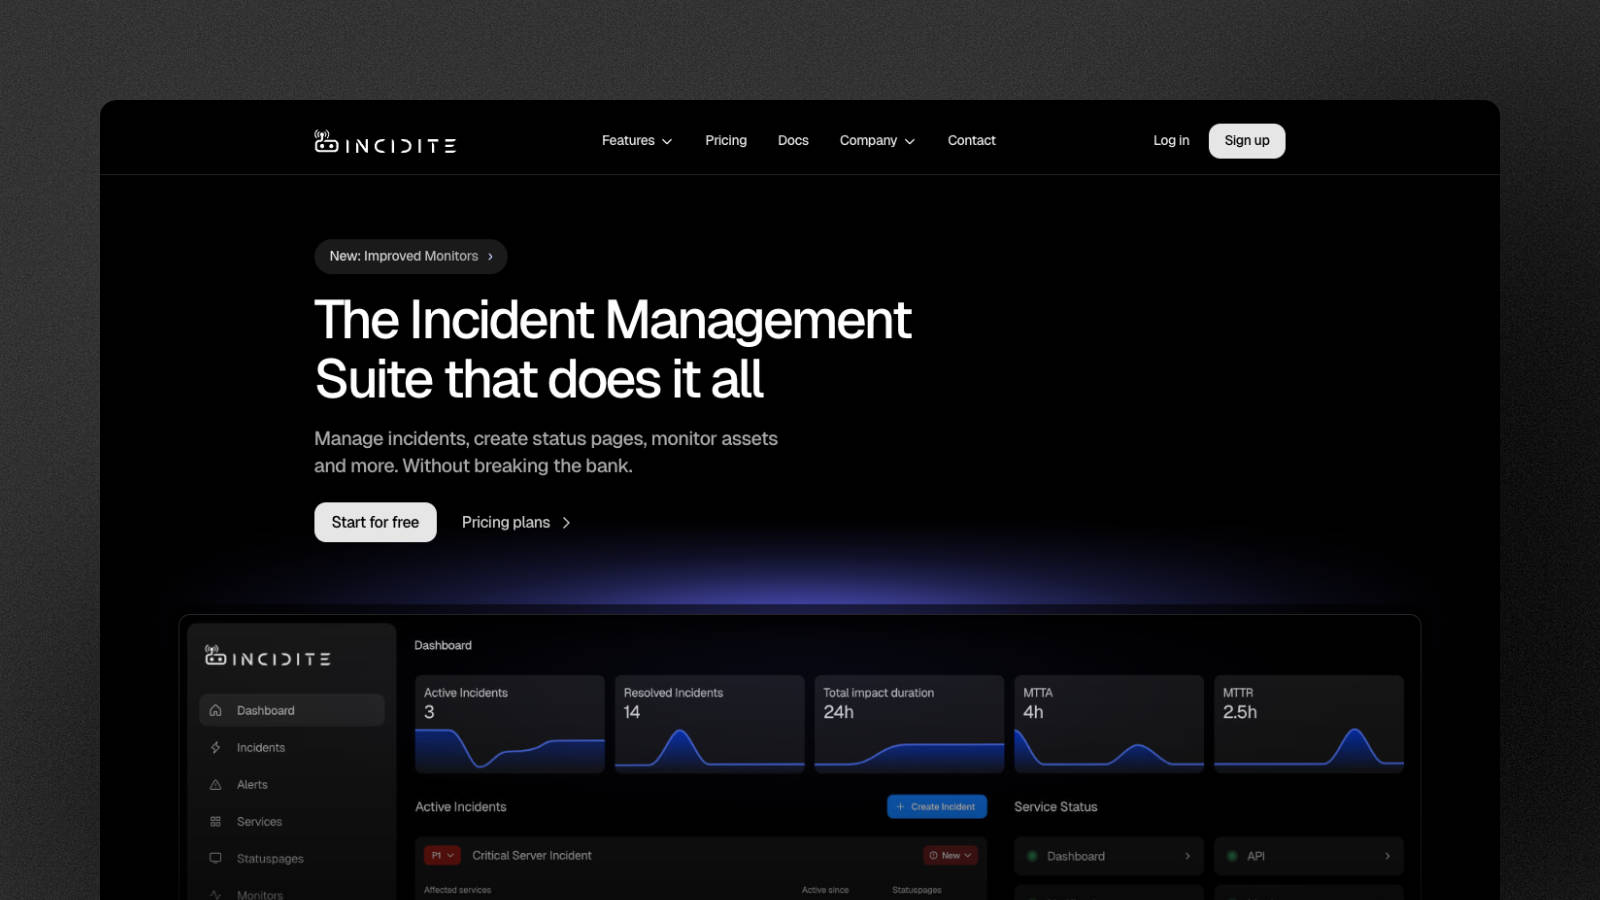
Incidite is a modern incident management platform that brings incident handling, monitoring and status pages together in one place.
As a cloud service, Incidite combines classic monitoring with automated incident management. That means: when a monitor fires, alerts can be generated, an incident is created and even a status page for customers can be updated – all within the same platform.
You don’t have to host separate monitoring software. You simply log in and configure your monitors in the app. A simple UI makes it easy to get started, and the core features can be used for free up to a certain point.
✅ Pros
HTTP monitoring with very fast check intervals
Server and network monitoring via ICMP ping
Detailed performance metrics (DNS resolution, connection setup, TLS handshake, time‑to‑first‑byte and more)
Measurement of packet loss and latency
Fast alerting as soon as your monitors fail
Automatic incident creation from alerts
Intelligent alert correlation to avoid alert fatigue
Built‑in status page
⚙️ Integrations
Prometheus Alertmanager
Slack
Discord
Microsoft Teams (planned)
You can find the full list of all Incidite integrations here.
❌ Cons
Depending on your use case, available metrics per monitor might not be sufficient
Integration ecosystem is still relatively small
💰 Pricing
Incidite offers affordable plans (€16 for Basic and €41 for Pro) compared to many competitors, suitable even for larger environments and teams. In the free plan, you can already use monitors and status pages in production, and there’s a trial phase to test all features of the paid plans.
2. PRTG Network Monitor
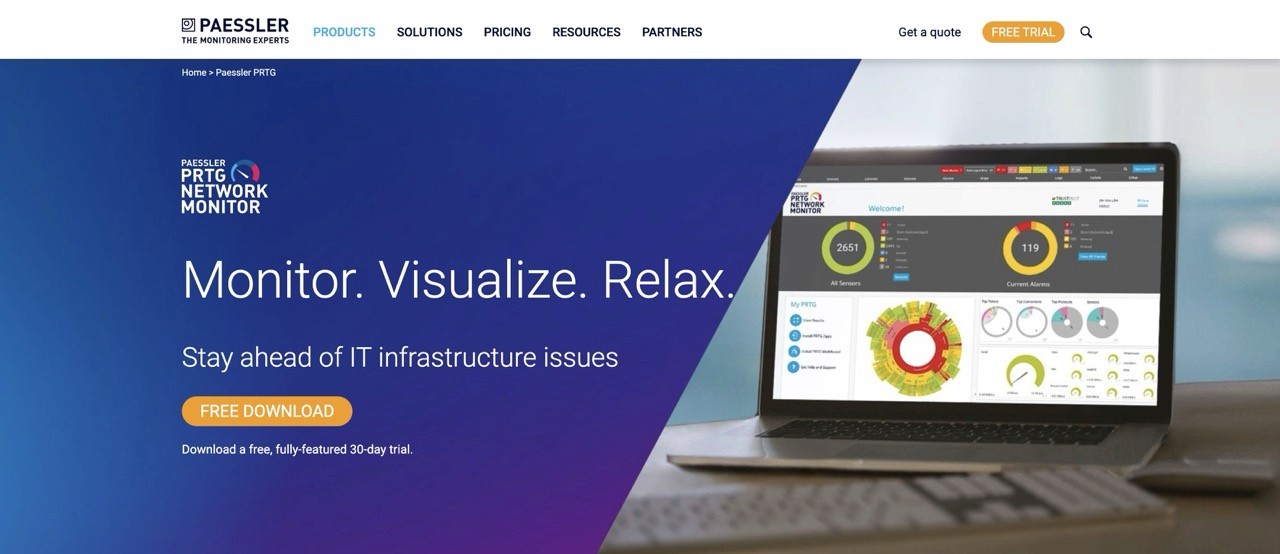
PRTG Network Monitor is an all‑round monitoring tool that you install on‑premises or run as a hosted service. PRTG provides broad device and protocol coverage and detailed data for your monitors.
If your main goal is to monitor network and infrastructure and collect a lot of metrics, PRTG is a strong option. It can also handle web and application monitoring, but its main strength clearly lies in network visibility.
✅ Pros
Comprehensive infrastructure monitoring
User‑friendly web UI and mobile apps
Customisable dashboards
Flexible alerts via email, SMS, PagerDuty or Slack
Regular reports on availability and averages
⚙️ Integrations
Slack
Microsoft Teams
ServiceNow
PagerDuty
Grafana
You can find the full list of all PRTG integrations here.
❌ Cons
Costs can grow quickly as your infrastructure and sensor count increase
Core server only runs on Windows
💰 Pricing
PRTG offers a 30-day trial with full access to all features. Plans start at around €150 per month for PRTG 500 (roughly 50 devices) and scale up to about €1,350 per month for PRTG 10000 (roughly 1,000 devices). PRTG counts sensors, not devices - expect 5 to 10 sensors per device, so the 1,000-sensor plan covers around 100-200 devices, not 1,000.
3. Zabbix
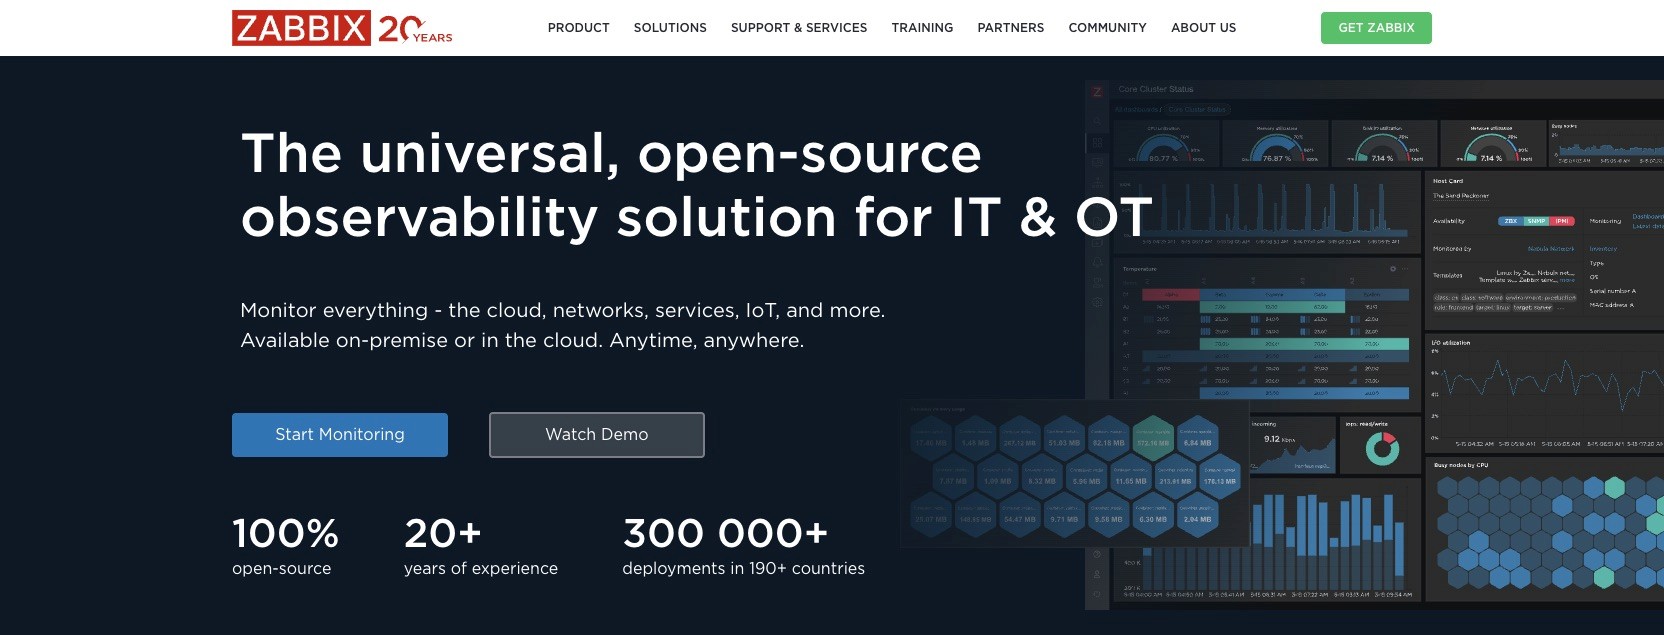
Zabbix is a long-standing open-source monitoring system that's free to use and known for its flexibility and active community. Zabbix 7.0 LTS added native synthetic web monitoring with multi-step browser scenarios - a feature you'd otherwise pay for separately. Zabbix 8.0 LTS, released in late 2025, brought ClickHouse as an optional storage backend for very large environments.
It's well-suited for diverse environments, but requires more initial setup and operational effort than many commercial tools. You're responsible for installing, updating and running the system yourself.
That effort pays off if you want maximum control over your monitoring setup. Zabbix is a powerful tool for professionals who prefer open software and want to tailor their monitoring environment to their exact needs.
✅ Pros
Broad monitoring coverage
Agent‑based and agentless (you can integrate practically any device and service)
Flexible configuration options
No licence fees
Designed for large environments with high scalability
⚙️ Integrations
ServiceNow
Jira
Zendesk
Slack
Microsoft Teams
PagerDuty
Grafana
You can find the full list of all Zabbix integrations here.
❌ Cons
High initial setup effort and a steep learning curve
For large environments, Zabbix can be noticeably CPU and RAM intensive
💰 Pricing
Zabbix itself is free as an open‑source solution. Companies can optionally purchase support subscriptions with SLAs if they need enterprise support.
4. Pingdom
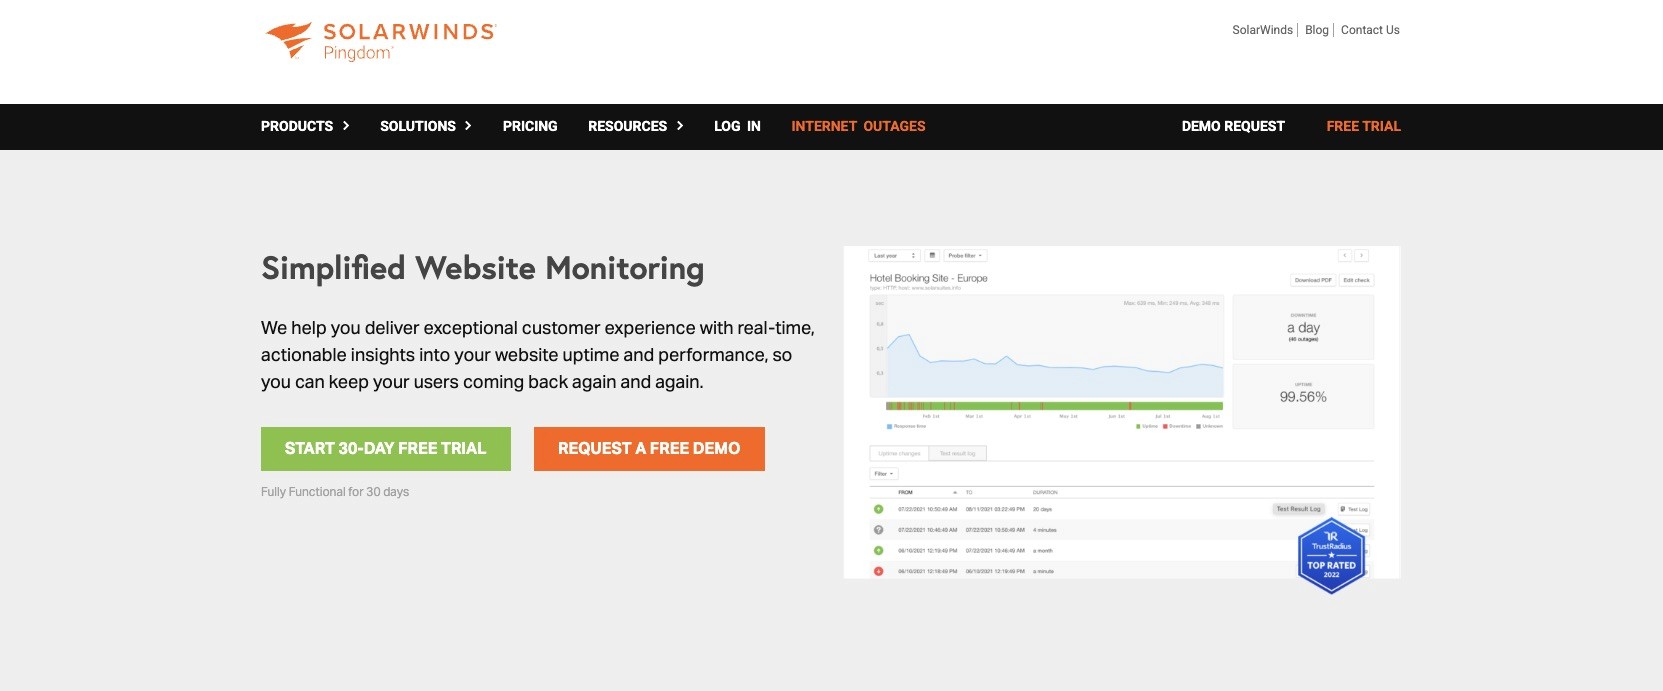
Pingdom (officially SolarWinds Pingdom since 2018) is a well-known website monitoring tool focused on web service monitoring. If your main goal is to keep an eye on the availability and load times of your website or web app, Pingdom is a long-established choice - though it's faced more criticism in 2025/2026 for evolving more slowly than newer competitors.
Since Pingdom specialises in external monitoring, it's not a full infrastructure tool. It doesn't track internal server metrics or network devices, but it complements internal monitoring stacks well.
✅ Pros
Worldwide uptime monitoring from multiple global locations
Detection of regional issues via distributed checkpoints
Measurement of page load times
Monitoring of multi‑step user flows such as logins or shop checkouts
Simple notifications via email, SMS or push
Availability reports and historical statistics
Public status overview pages
⚙️ Integrations
Slack
PagerDuty
Opsgenie
Atlassian Statuspage
You can find the full list of all Pingdom integrations here.
❌ Cons
Not a full infrastructure or APM tool – you’ll need additional solutions alongside it
With many checks and alerts, costs can rise quickly
💰 Pricing
Pingdom uses modular subscription plans for synthetic monitoring and real user monitoring, starting at around $16.50/month per module. All plans come with a free trial so you can test them before committing.
5. Site24x7
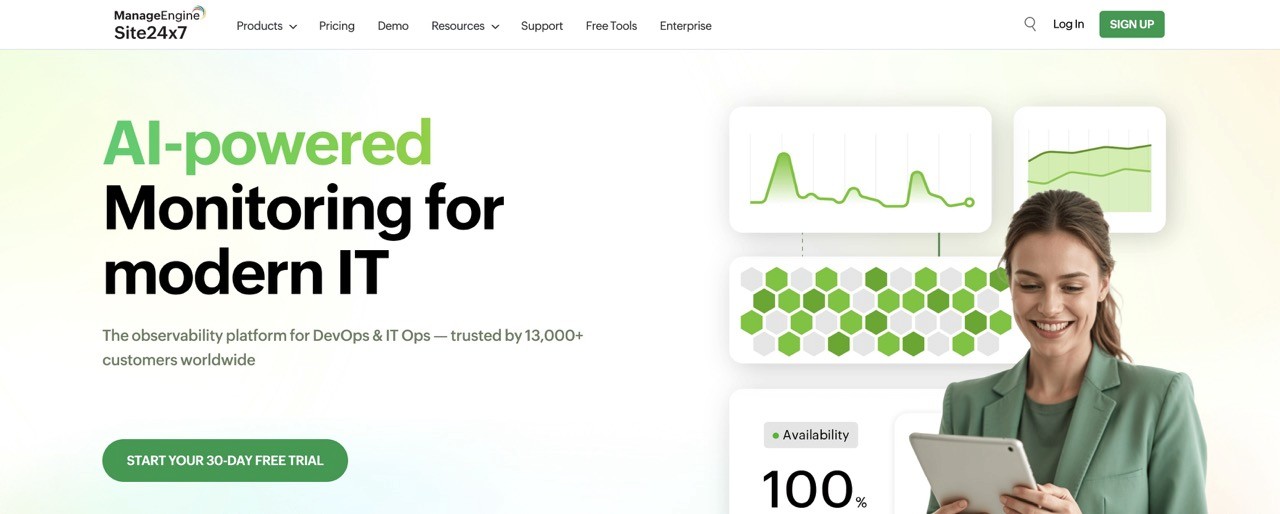
Site24x7 is a comprehensive cloud monitoring platform that gives you an end‑to‑end view of modern IT environments.
It combines many capabilities in a single solution: server and network monitoring, cloud services, containers, APM (Application Performance Monitoring) and synthetic monitoring.
In certain areas, Site24x7 isn’t as deep as some specialised tools. But for most small and mid‑sized organisations, it offers more than enough features plus the big advantage of having everything in a single interface.
✅ Pros
Classic on‑prem infrastructure monitoring
Direct integration of your cloud resource metrics
Website and API monitoring
Real User Monitoring via browser snippet
Integrated APM module
Network monitoring and built‑in log analysis component
User‑friendly, modular system
⚙️ Integrations
Slack
Microsoft Teams
ServiceNow
PagerDuty
Opsgenie
Zapier
You can find the full list of all Site24x7 integrations here.
❌ Cons
User interface can feel crowded and a bit dated
Complex pricing and add‑on structure
💰 Pricing
Site24x7 offers several all‑in‑one plans starting at €9 per month, plus larger packages for more extensive environments. There is a forever‑free plan with limited features and a 30‑day full trial for the paid plans.
TLDR: Tool overview
Tool | Buy if | Don't buy if |
|---|---|---|
Incidite | you mainly need HTTP/API and ping monitoring plus incident management and status pages as a cost‑efficient all‑in‑one solution. | you expect a single tool to also deliver deep server, log and APM monitoring out of the box. |
PRTG Network Monitor | you run a mostly Windows‑based corporate network with many devices and protocols and want broad monitoring coverage. | you’re Linux‑only or fully cloud‑native, don’t want to run a Windows monitoring server or have a very tight budget. |
Zabbix | you have an experienced Linux/DB team, can invest time into setup and tuning, and prefer a scalable open‑source solution with no licence fees. | you’re a small team with little Linux expertise or need a ready‑to‑use solution with minimal maintenance. |
Pingdom | external uptime, performance and transaction checks for websites and web apps are your top priority and you want to easily integrate this data into your existing alerting stack. | you want a single tool to also monitor servers, networks and logs, or you need a huge number of checks on a very low budget. |
Site24x7 | you’re looking for a comprehensive cloud platform covering websites, servers, network, cloud and containers, and you’re okay with a feature‑rich, slightly dense UI. | you want a very lean, highly specialised tool or expect observability depth on the level of premium APM suites. |
FAQ Monitoring Tools
What are monitoring tools?
What types of monitoring are there?
What is monitoring – in simple terms?
What is a monitoring program?
Which monitoring tool is best for DevOps teams in 2026?
Thanks for reading!
Got a suggestion or need help? Let us know